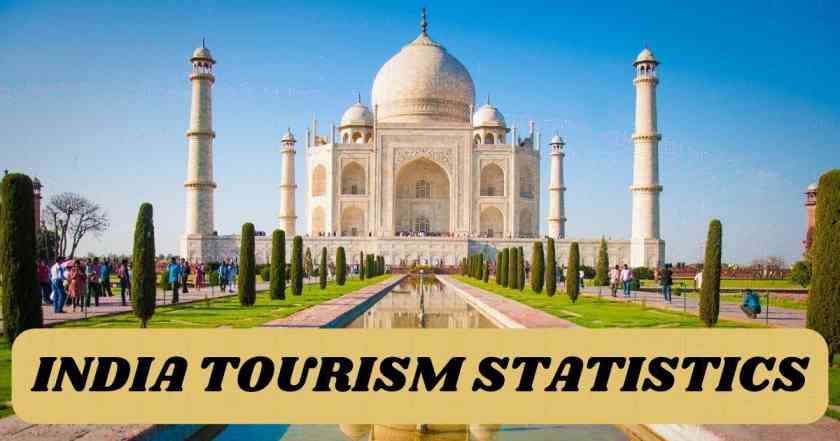
Tourism in India Statistics 2024
Tourism in India
Tourism in India is a significant contributor to the country’s economy, offering diverse cultural, historical, natural, and adventure attractions to travellers from around the world. India attracts tourists from diverse countries, serving as a hotspot for all kinds of travellers. Its rich culture, warm people, flavourful cuisines, and captivating history create an irresistible allure. India is truly a country born to fascinate, with its tourism always abuzz. Tourists seek thrill, magic, and wonder, and India offers a wholesome experience like no other. The country’s rich heritage and vibrant culture leave foreign tourists awestruck, drawing them closer to India’s charming surprises with every encounter.
What is Popular in India? India is renowned for its finest architectural heritage, serene ghats, spectacular landscapes, and the largest tiger reserve. What is famous in India? From the grandeur of the Taj Mahal, counted among the wonders of the world, to opulent palaces and forts, India showcases a diverse array of heritage riches crafted centuries ago. Forbes magazine has recognized India’s natural beauty by ranking it as the 7th most beautiful country in ‘The 50 Most Beautiful Countries In The World’ rankings.
Economic Contribution: Tourism is a major source of revenue and employment in India. Tourism industry accounts for 4.6% of India’s gross domestic product (GDP). It contributes to foreign exchange earnings, GDP growth, and job creation, both directly and indirectly. Around 70.04 million number of jobs were created according to the data provided by the Ministry of Tourism. Rs.1,66,660 crore has been earned through Foreign Exchange Earnings in 2024.
The Government of India has set a target of achieving $56 billion in foreign exchange earnings and creating approximately 140 million jobs in the tourism sector by 2030. This vision emphasizes inclusive growth and places special emphasis on developing cruise tourism, ecotourism, and adventure tourism.
By 2028, India’s tourism and hospitality industry is expected to achieve significant growth, with projected revenue exceeding $59 billion. Additionally, Foreign Tourist Arrivals (FTAs) are anticipated to reach 30.5 million by the same year. This growth trajectory highlights the immense potential of India’s tourism sector and underscores the country’s attractiveness as a global destination for travelers.
Types of Tourism in India
- Historical and Cultural Tourism: India is home to several UNESCO World Heritage Sites, including the Taj Mahal, Red Fort, Qutub Minar, Hampi, and Jaipur’s Amer Fort, among others. These sites attract millions of tourists every year.
- Religious Tourism: India is known for its religious diversity and pilgrimage sites, including Varanasi, Haridwar, Rishikesh, Velankanni, and Amritsar, among others. These sites attract millions of domestic and international religious tourists.
- Adventure Tourism: India offers a range of adventure activities such as trekking in the Himalayas, white-water rafting in Rishikesh, wildlife safaris in national parks, and water sports in coastal regions like Goa.
- Medical Tourism: India has emerged as a popular destination for medical tourism, offering high-quality healthcare services at relatively lower costs compared to Western countries. States like Kerala, Tamil Nadu are hubs for medical tourism.
Foreign Tourists in India
Foreign tourists in India contribute significantly to the country’s tourism industry. They come from all over the world to explore India’s diverse cultural heritage, historical landmarks, natural beauty, and vibrant traditions. Foreign tourists often visit iconic attractions such as the Taj Mahal, Jaipur’s Amer Fort, Kerala’s backwaters, and the beaches of Goa.
These tourists play a crucial role in boosting local economies, supporting small businesses, and generating employment opportunities in the tourism sector. They also contribute to cross-cultural exchange and promote understanding between nations.
However, the number of foreign tourists in India can be influenced by various factors, including geopolitical situations, travel advisories, economic conditions, and global pandemics like COVID-19. Nevertheless, India remains a popular destination for foreign travellers seeking unique and enriching experiences.
Between January and September 2023, India welcomed approximately 6.43 million foreign tourists. This figure represents a considerable increase compared to the preceding year’s total and even exceeds the entire year’s foreign tourist arrivals in 2022. The notable surge in tourist arrivals during this timeframe suggests a positive trajectory for the tourism sector, possibly influenced by effective marketing initiatives, relaxed travel restrictions, or other factors enhancing India’s appeal as a destination.
In efforts to boost the influx of international tourists to India, the Ministry of Tourism actively participated in numerous international travel fairs throughout the year 2023. These events provided platforms for showcasing India’s rich cultural heritage, diverse attractions, and unique experiences to a global audience. By engaging in such international platforms, the Ministry aimed to enhance India’s visibility as a preferred travel destination and attract more foreign visitors to explore the country’s treasures.
Foreign Tourists Statistics 2024
| Year | Foreign Tourists Arrival (FTAs) in India (in million) |
|---|---|
| 2019 | 10.93 |
| 2020 | 2.74 |
| 2021 | 1.52 |
| 2022 | 6.44 |
| 2023 (Jan – Sep) | 6.43 |
The table presents data according to the Ministry of Tourism on Foreign Tourists Arrival (FTAs) in India from 2019 to 2023 (Jan – Sep). The data reveals a notable fluctuation in FTAs over the years, with significant declines observed in 2020 and 2021, coinciding with the peak of the COVID-19 pandemic. In 2020, FTAs plummeted to 2.74 million, reflecting the severe impact of global travel restrictions and health concerns. The decline persisted in 2021, with FTAs further dropping to 1.52 million, highlighting the continued challenges faced by the tourism sector amid the pandemic.
However, the data also indicates a promising recovery in 2022, with FTAs more than doubling compared to the previous year, reaching 6.44 million. This recovery could be attributed to the gradual easing of travel restrictions, increased vaccination rates, and the adaptation of the tourism industry to new health and safety protocols.
In 2023, from January to September, there were 6.43 million foreign tourist arrivals in India. This figure marks a notable increase compared to the previous year’s data and surpasses the total number of foreign tourist arrivals for the entire year of 2022. The significant uptick in tourist arrivals during this period suggests a positive trend in the tourism sector, potentially indicating successful marketing strategies, easing of travel restrictions, or other factors contributing to the surge in international travellers visiting India. This insight underscores the resilience of the tourism industry and highlights the potential for continued growth and recovery in the sector.
The analysis underscores the profound impact of the COVID-19 pandemic on the tourism sector in India, highlighting the need for robust policies and strategies to navigate through crises and support the recovery of the industry. Effective destination marketing, enhanced safety measures, and continuous monitoring of travel trends will be essential for driving sustainable growth in international tourism in India in the post-pandemic era.
Foreign Exchange Earning (FEEs) 2024
| Year | Foreign Exchange Earnings (FEEs) (in crore) |
|---|---|
| 2019 | 2,16,467 |
| 2020 | 50,136 |
| 2021 | 65,070 |
| 2022 | 1,39,935 |
| 2023 (Jan – Sep) | 1,66,660 |
According to the Ministry of Tourism, data on Foreign Exchange Earnings (FEEs) in crore from 2019 to 2023 (Jan – Sep) reveals a notable fluctuation in earnings, reflecting the volatile nature of the tourism sector. In 2019, foreign exchange earnings reached the highest level at Rs.2,16,467 crore, indicating a robust performance in that year. However, the onset of the COVID-19 pandemic in 2020 led to a drastic decline in earnings, plummeting to Rs.50,136 crore. This sharp decrease was a result of travel restrictions, lockdowns, and safety concerns that severely impacted international travel and tourism activities.
Despite the challenges posed by the pandemic, there was a slight improvement in 2021, with foreign exchange earnings increasing to Rs.65,070 crore. This uptick suggests some resilience within the tourism sector amid the ongoing uncertainties. A significant recovery was observed in 2022, with earnings rebounding to Rs.1,39,935 crore, signalling a positive turnaround in the industry as travel restrictions eased and vaccination efforts progressed. The data for 2023 (Jan – Sep) further reinforces this recovery trend, with earnings reaching Rs.1,66,660 crore during the first nine months of the year.
The fluctuation in foreign exchange earnings underscores the impact of external factors, particularly the COVID-19 pandemic, on the tourism industry’s performance. Efforts to revive the sector, including vaccination campaigns, implementation of safety protocols, and promotional activities, have played a crucial role in driving the gradual recovery observed in 2022 and 2023 (Jan – Sep). However, uncertainties remain, including the potential for future waves of COVID-19 and geopolitical factors, which could affect the tourism sector’s growth trajectory.
Moving forward, continued efforts to promote tourism, enhance infrastructure, and ensure visitor safety will be essential for sustaining the positive momentum in foreign exchange earnings. The data highlights the resilience and adaptability of the tourism sector in navigating through challenges and underscores the importance of collaborative efforts to support its recovery and long-term growth.
Employment Generated by Tourism of India
| S.No. | Financial Year | Number of Jobs (in Million) |
|---|---|---|
| 1 | 2019-20 | 69.44 |
| 2 | 2020-21 | 68.07 |
| 3 | 2021-22 | 70.04 |
The table provides insights into the number of jobs (in millions) in the tourism sector in India across three financial years: 2019-20, 2020-21, and 2021-22. In 2019-20, the tourism sector employed 69.44 million individuals, indicating a robust level of employment within the industry. This figure suggests a healthy level of activity and employment opportunities within the tourism sector during that financial year, highlighting its significance as a major source of employment in India’s economy.
However, the subsequent financial year, 2020-21, witnessed a slight decline in the number of jobs to 68.07 million. This decline is notable and can be attributed to various factors, with the most significant being the onset of the COVID-19 pandemic. The pandemic brought about unprecedented challenges and disruptions to the global tourism industry, affecting travel patterns, consumer behavior, and employment within the sector. The decline in employment during this period reflects the initial shock and impact of the pandemic on the tourism sector in India.
Despite the challenges posed by the pandemic, the financial year 2021-22 saw a notable rebound in employment within the tourism sector, with the number of jobs increasing to 70.04 million. This increase surpassed the pre-pandemic level of 2019-20, indicating a remarkable recovery in the sector. Several factors may have contributed to this rebound, including the gradual easing of COVID-19 restrictions, widespread vaccination drives, and pent-up demand for travel and tourism activities. The increase in employment during this financial year signals a positive turnaround for the tourism sector in India, reflecting its resilience and ability to adapt in the face of adversity.
Top Sources of Visitors to India 2024
| Country | FTAs | Percentage Share (%) |
|---|---|---|
| UNITED STATES | 13,73,817 | 22.19% |
| BANGLADESH | 12,55,960 | 20.29% |
| UNITED KINGDOM | 6,17,768 | 9.98% |
| AUSTRALIA | 3,69,023 | 5.96% |
| CANADA | 2,77,291 | 4.48% |
| SRI LANKA | 1,77,652 | 2.87% |
| NEPAL | 1,35,347 | 2.19% |
| GERMANY | 1,24,496 | 2.01% |
| SINGAPORE | 1,17,195 | 1.89% |
| MALAYSIA | 1,16,523 | 1.88% |
According to the Ministry of Tourism, the top countries contributing to FTAs to India are the United States, Bangladesh, and the United Kingdom. The United States has the highest number of FTAs, with approximately 13.73 lakhs, accounting for 22.19% of the total FTAs. Bangladesh follows closely behind, with around 12.56 lakhs FTAs, constituting 20.29% of the total. The United Kingdom ranks third with 6.17 lakhs FTAs, making up 9.98% of the total.
Australia, Canada, and Sri Lanka also make significant contributions to FTAs to India, albeit to a lesser extent compared to the top three countries. Australia accounts for approximately 3.69 lakhs FTAs (5.96%), while Canada contributes around 2.77 lakhs FTAs (4.48%). Sri Lanka’s contribution stands at approximately 1.77 lakhs FTAs (2.87%).
It’s worth noting that while the United States and Bangladesh lead in terms of absolute numbers of FTAs, countries like Australia and the United Kingdom also hold substantial percentage shares. This indicates not only the importance of these countries in terms of visitor numbers but also their significance in terms of their share of the overall tourism market to India.
Overall, the data underscores the diverse range of countries contributing to India’s tourism sector and highlights the importance of key markets such as the United States, Bangladesh, and the United Kingdom in driving foreign tourist arrivals to the country. Understanding these trends can help in formulating targeted strategies to further enhance India’s attractiveness as a tourist destination for visitors from around the world.
Number of Domestic Tourist Visits to all States in India during 2011-2022
| Year | No. of Domestic Tourist Visits (in Millions) to States/UTs | Percentage Change over the Previous Year (%) |
|---|---|---|
| 2011 | 864.53 | 15.63 |
| 2012 | 1045.05 | 20.88 |
| 2013 | 1142.53 | 9.33 |
| 2014 | 1282.8 | 12.28 |
| 2015 | 1431.97 | 11.63 |
| 2016 | 1615.39 | 12.81 |
| 2017 | 1657.55 | 2.61 |
| 2018 | 1853.78 | 11.84 |
| 2019 | 2321.98 | 25.26 |
| 2020 | 610.22 | -73.72 |
| 2021 | 677.63 | 11.05 |
| 2022 | 1731.01 | 155.45 |
From 2011 to 2019, there’s a consistent upward trend in the number of domestic tourist visits, with year-over-year percentage changes ranging from single digits to over 25%. This period reflects a growing interest in domestic tourism, possibly driven by factors such as increased disposable income, improved infrastructure, and promotional efforts by tourism authorities.
In 2020, however, there’s a notable and unprecedented decline in domestic tourist visits, dropping to 610.22 million visits, a staggering 73.72% decrease from the previous year. This sharp decline can be attributed to the COVID-19 pandemic and the resultant lockdowns and travel restrictions implemented across the country, severely impacting the tourism industry.
The rebound in 2021 is evident with a significant increase in domestic tourist visits to 677.63 million, representing an 11.05% growth over the previous year. This recovery can be attributed to the gradual easing of restrictions, pent-up demand for travel, and the adaptation of safety protocols by the tourism sector to encourage travel amid the ongoing pandemic.
In 2022, there’s a remarkable resurgence in domestic tourism, with the number of visits soaring to 1731.01 million, marking an astonishing 155.45% increase compared to 2021. This surge reflects a strong rebound in travel demand as the effects of the pandemic wane, coupled with increased vaccination rates, the resumption of economic activities, and renewed consumer confidence in travel.
Top 10 States in Number of Domestic Tourist Visitors
| State/UT | Domestic Tourist Visits (in Million) | Percentage Share |
|---|---|---|
| Uttar Pradesh | 317.91 | 18.37 |
| Tamil Nadu | 218.58 | 12.63 |
| Andhra Pradesh | 192.72 | 11.13 |
| Karnataka | 182.41 | 10.54 |
| Gujarat | 135.81 | 7.85 |
| Maharashtra | 111.30 | 6.43 |
| Rajasthan | 108.33 | 6.26 |
| West Bengal | 84.75 | 4.88 |
| Telangana | 60.75 | 3.51 |
| Uttarakhand | 54.64 | 3.16 |
Uttar Pradesh emerges as the top destination for domestic tourism, with a staggering 317.91 million visits, representing a significant 18.37% share of the total domestic tourist visits. This suggests the state’s rich cultural heritage, historical landmarks such as the Taj Mahal, and vibrant festivals attract a large number of domestic travelers.
Tamil Nadu and Andhra Pradesh follow closely, with 218.58 million and 192.72 million visits respectively, accounting for 12.63% and 11.13% of the total domestic tourist visits. These states are known for their diverse attractions, including ancient temples, scenic beaches, and cultural experiences, contributing to their popularity among domestic tourists.
Karnataka and Gujarat also attract a considerable number of domestic tourists, with 182.41 million and 135.81 million visits respectively, capturing 10.54% and 7.85% of the total domestic tourist visits. These states offer a mix of heritage sites, wildlife sanctuaries, and modern amenities, catering to a wide range of interests among domestic travelers.
Maharashtra, Rajasthan, and West Bengal are also notable destinations, each receiving over 100 million domestic tourist visits. These states boast iconic landmarks, vibrant cities, and diverse cultural experiences, contributing significantly to the domestic tourism landscape.
Telangana and Uttarakhand, although receiving comparatively fewer visits, still contribute to the overall domestic tourism sector, attracting 60.75 million and 54.64 million visits respectively.
Number of Approved Hotels and Availability of Hotel Rooms in India 2014
| Category of Hotels | No. of Hotels | No. of Rooms |
|---|---|---|
| One Star | 18 | 610 |
| Two Star | 23 | 879 |
| Three Star | 524 | 16,736 |
| Four Star with Alcohol | 212 | 13,386 |
| Four Star without Alcohol | 143 | 5,367 |
| Five Star Deluxe | 172 | 39,212 |
| Five Star with Alcohol | 143 | 18,972 |
| Five Star without Alcohol | 56 | 5,818 |
| Total | 1,291 | 1,00,980 |
We present a comprehensive breakdown of hotel accommodations in various categories, shedding light on the diversity and scale of the hospitality sector in India.
One Star and Two Star hotels, although relatively few in number with 18 and 23 establishments respectively, collectively offer a substantial number of rooms, totaling 1,489. This suggests that while these categories may be limited in terms of the number of hotels, they still contribute significantly to the overall availability of rooms for travelers seeking budget-friendly options.
Three Star hotels dominate the landscape with 524 establishments, offering a sizable 16,736 rooms. This category caters to a broad range of travelers, providing mid-range accommodations with a focus on comfort and amenities.
Four Star hotels, both with and without alcohol, cater to a more upscale clientele, with 212 and 143 establishments respectively. These hotels offer a luxurious experience, with amenities and services tailored to meet the needs of discerning travelers. Despite their relatively lower number of establishments, they provide a substantial number of rooms, totaling 13,386 and 5,367 respectively.
Five Star Deluxe hotels, comprising 172 establishments, are synonymous with luxury and extravagance, offering premium accommodations and world-class amenities. With a staggering 39,212 rooms, they represent the epitome of opulence in the hospitality sector.
Disclaimer: The data research report provided here is sourced from various channels, aiming for accuracy but unable to guarantee every detail’s absolute precision. It is intended for informational purposes only, and users are urged to verify critical information independently before making decisions. We are not liable for any financial loss, errors, or damages arising from the use of this information. While our team strives for accuracy, the dynamic nature of data means we cannot verify every fact. Your understanding and discretion are valued.